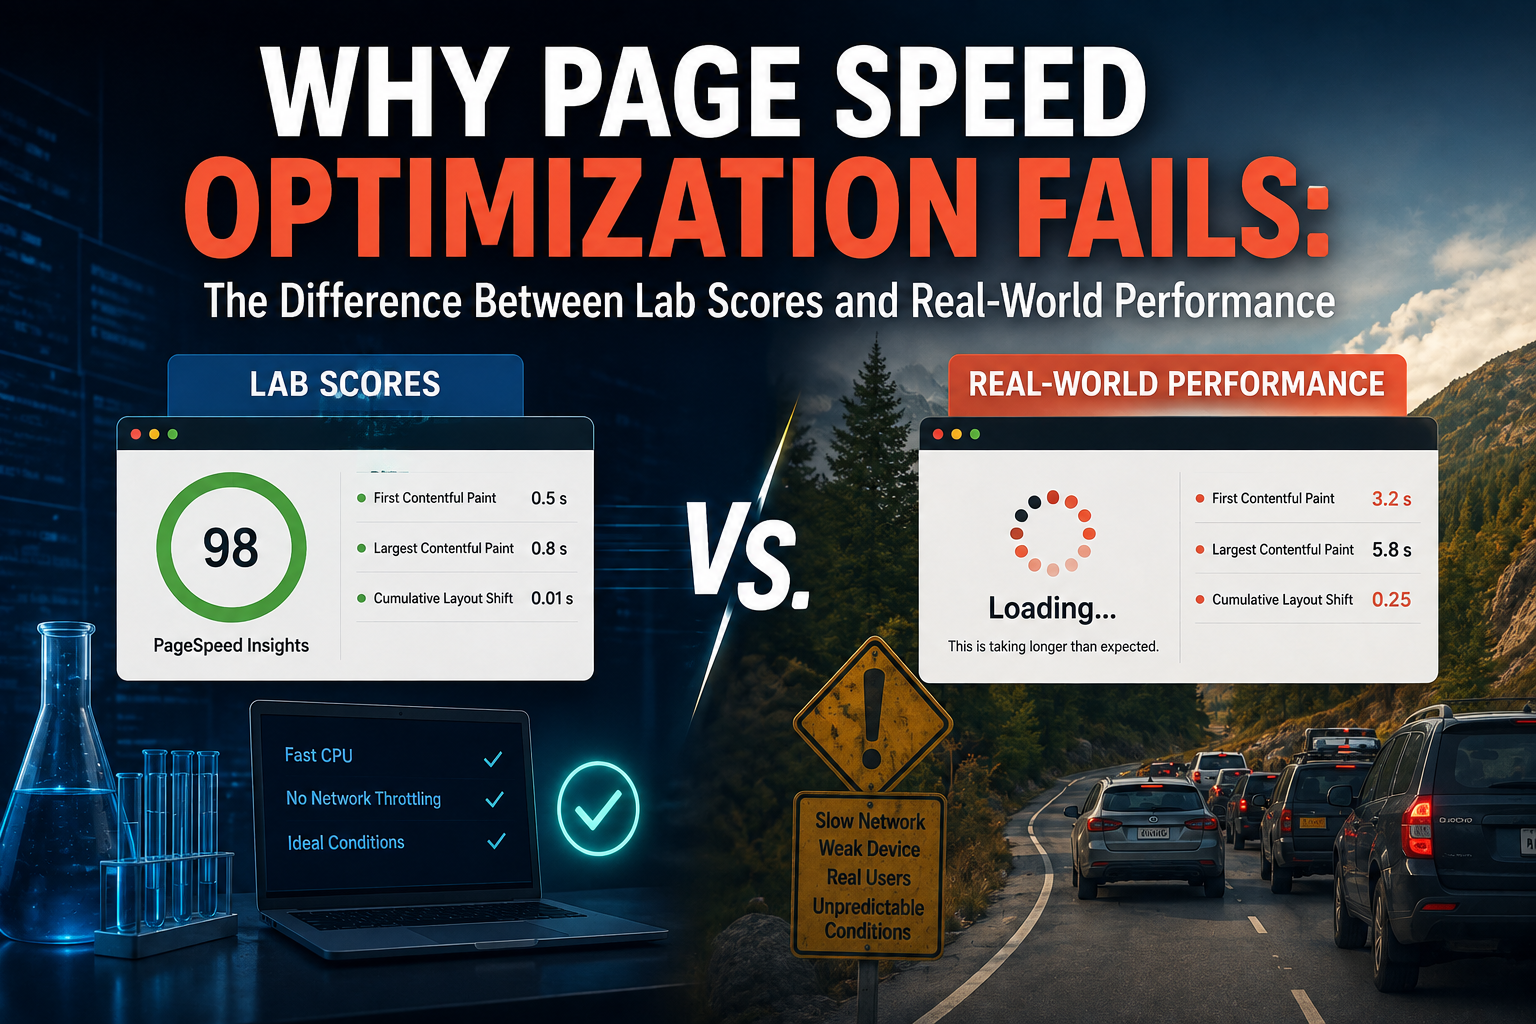
There is a particular kind of despair that sets in when you have done everything right and the results still refuse to show up. You have compressed your images, minified your scripts, implemented lazy loading, and maybe even switched to a faster hosting provider. Your Lighthouse score glows green across the board. Your Core Web Vitals report in Google Search Console shows passing grades. You sit back, expecting a surge in rankings and conversions, and instead you watch your bounce rate stay stubbornly high and your organic traffic barely twitch. The tools told you that you had won, but your users and your business are telling a different story. This is the gap between lab scores and real-world performance, and it is where most page speed optimization efforts quietly die.
Lab scores are seductive because they are clean, controllable, and instantly gratifying. Tools like Google Lighthouse run a simulated test on your page under idealized conditions. They use a predefined network speed, a specific device profile, and a consistent server response time. They measure your page in a vacuum, stripped of the messy variables that define actual human browsing behavior. When you run Lighthouse on your own machine, connected to a fast office network, with no other tabs competing for resources, you are essentially testing your page in a sterile laboratory. The score you receive is real, but it is not reality. It is a snapshot of potential, not a portrait of experience.
Real-world performance, measured through field data like the Chrome User Experience Report, captures something entirely different. It aggregates how actual users experience your site across thousands of different devices, network conditions, geographic locations, and browsing contexts. It includes the person loading your site on a three-year-old Android phone over a congested coffee shop Wi-Fi connection. It includes the user on a rural mobile network with spotty coverage. It includes the shopper who has fifteen other browser tabs open, a streaming video running in the background, and a device that is throttling its processor to preserve battery life. These are not edge cases. They are the majority of your audience, and they are invisible in your lab scores.
The disconnect between these two worlds creates a dangerous illusion of competence. A developer can optimize a site until it scores ninety-nine on Lighthouse and still deliver a miserable experience to a significant portion of real users. The lab test might show a Largest Contentful Paint of one point two seconds, but the field data might reveal that your seventy-fifth percentile user is waiting four or five seconds before the main content becomes visible. That gap is not a rounding error. It is the difference between a user who stays and a user who leaves. Google uses field data, not lab scores, for its Core Web Vitals assessments that influence rankings. So even if your Lighthouse report looks perfect, you might still be failing the metrics that actually matter for search visibility.
One of the most common traps is optimizing for the test rather than the user. Developers learn what Lighthouse measures and start tailoring their optimizations to game those specific metrics. They might delay the loading of non-critical scripts until after the initial paint to improve their First Contentful Paint score, only to have those scripts execute moments later and block interactivity, creating a frustrating experience where the page looks ready but does not respond to taps or clicks. They might preload hero images to improve Largest Contentful Paint while ignoring the fact that those images are massive and consume enormous bandwidth for users on limited data plans. The metric looks good, but the user experience suffers. This is optimization theater, performative speed that impresses tools and disappoints humans.
Third-party scripts are another area where lab scores routinely fail to capture real-world pain. In a controlled test environment, these scripts might load quickly and not interfere with core metrics. But in the wild, third-party services behave unpredictably. Analytics platforms, chat widgets, advertising networks, social media embeds, and marketing pixels all compete for bandwidth and processing power. They can introduce render-blocking requests, cause layout shifts when they finally load, or slow down interactivity as they execute complex JavaScript. A single slow third-party script can turn a fast page into a sluggish one, and this degradation often does not show up in lab testing because the test might not trigger the same ad auctions, the same geographic content delivery network routing, or the same real-time bidding processes that happen when an actual user visits your page.
Caching is another factor that lab environments rarely replicate accurately. In a Lighthouse test, your page is loaded fresh, with no cached resources. In reality, many of your returning visitors have portions of your site stored in their browser cache or on a content delivery network edge server near them. This means their experience might actually be faster than the lab suggests. But the inverse is also true. First-time visitors, or users who have cleared their cache, or visitors hitting an edge server that does not yet have your assets cached, will experience significantly slower load times. Lab tests typically do not account for cache variability, so they can either overestimate or underestimate the real experience depending on your audience composition.
Geographic distribution of your users introduces another layer of complexity that lab scores ignore. If you run Lighthouse from your office in New York, you are testing how fast your site loads from a data center likely located on the East Coast of the United States. But if forty percent of your traffic comes from Southeast Asia, Latin America, or Eastern Europe, those users are requesting your content from servers thousands of miles away, often across undersea cables with higher latency and through content delivery networks with sparser coverage. The lab score tells you nothing about their experience. A page that feels instant in New York might feel sluggish in Manila, and that geographic penalty is invisible unless you are specifically measuring field data from those regions.
Device diversity is equally overlooked. Lab tests typically simulate a mid-range mobile device, but the actual range of devices accessing your site spans from the latest flagship smartphones to budget devices with limited RAM, slower processors, and outdated browsers. On a low-end device, the same JavaScript that executes in milliseconds on a modern phone can take seconds to parse and run. Layout shifts that are imperceptible on a powerful desktop machine can be jarring and disorienting on a small, slow screen. Lab scores assume a standardized device profile, but your users do not conform to standards. They use what they have, and what they have is often far less capable than the test assumes.
The obsession with lab scores also leads teams to neglect the metrics that matter most for business outcomes. Time to First Byte, First Contentful Paint, and Largest Contentful Paint are important, but they are not the whole story. Total Blocking Time and Interaction to Next Paint measure how quickly your page becomes responsive to user input, and these are often the metrics that correlate most strongly with conversion rates. A page that paints quickly but remains uninteractive for several seconds feels broken to users. They tap buttons that do nothing. They try to scroll and encounter stuttering or freezing. They abandon carts because the checkout process feels unresponsive. These are the moments where revenue is lost, and they are rarely the focus of a standard lab test.
So what does it actually look like to optimize for real-world performance rather than lab scores? It starts with a shift in mindset. You have to stop treating Lighthouse as the finish line and start treating it as a starting point. Run your lab tests, note the scores, and then immediately dig into your field data. Look at the distribution of experiences across your user base. Identify the percentiles where users are struggling. If your ninety-fifth percentile Largest Contentful Paint is eight seconds, that is where your attention should go, not to the one point two seconds that your lab test reported. Those struggling users represent real people, and they are likely your most valuable untapped audience because your competitors are probably ignoring them too.
Prioritize the metrics that align with business outcomes. If you run an e-commerce site, focus on reducing Total Blocking Time and improving Interaction to Next Paint so that users can actually add items to their cart and proceed through checkout without friction. If you run a content site, prioritize stable layout shifts so that users can read without text jumping around as ads and images load. If you serve a global audience, invest in a robust content delivery network with strong coverage in your highest-traffic regions, and consider server-side rendering or edge caching to reduce the distance data has to travel.
Test under realistic conditions. Throttle your network to simulate slow mobile connections. Test on actual low-end devices, not just emulators. Use real user monitoring tools that capture performance data from every visitor, not just synthetic tests that run on a schedule. Review your third-party scripts ruthlessly. Audit which ones are essential and which are merely convenient. Implement resource hints like preload, prefetch, and preconnect strategically, but test their impact on real users rather than assuming they help because they look good in a lab report.
Most importantly, treat performance as a continuous practice, not a one-time project. The web is dynamic. Your content changes, your third-party partners update their scripts, your traffic patterns shift, and your user base evolves. A site that was fast six months ago might be slow today because of accumulated technical debt, new features, or changes in how browsers handle certain technologies. Regularly revisit your field data, set alerts for when metrics degrade, and build a culture where performance is owned by the entire team, not just the developers who run Lighthouse before a launch.
The uncomfortable truth is that page speed optimization fails most often not because the techniques are wrong, but because the goalposts are misplaced. Chasing a perfect Lighthouse score is a vanity exercise if your real users are still waiting and still leaving. The metrics that matter are the ones measured in the chaos of the real world, where networks falter, devices struggle, and patience is thin. When you align your optimization efforts with that reality, you stop performing for tools and start delivering for people. And that is when speed finally translates into the rankings, engagement, and revenue you were chasing all along.